Static Generation, Dynamic Content
This is a static website—the content you’re reading now is generated once, for all visitors, then presented in the same way each time for each browser request. That’s slightly different from the (current) internet norm of generating content as it’s requested, possibly on a targeted per-user basis, and probably using a database or some server-side business logic. Think of Wordpress and its plugins as examples of the latter, while Pelican, Jekyll, and Octopress would be examples of the former.
As to why: static sites can be quicker for a browser to retrieve compared to ‘dynamic’ versions since they’re more easily cacheable by cdns out-of the-box. They also tend to have lower processing overhead for the servers which host them.
Even though the back-end mechanics are very different, there’s not as much variation in how the site content is written under either approach, since today’s websites typically use some kind of cms or templating system to create and organise content. Just because a website is static it doesn’t mean that you’re constrained to writing everything in pure, flat html, any more than a dynamic site would be written as a set of sql queries. For this site, everything is written in Markdown.
The basic goal of a static website is for its content to be complete and universal at the moment it is turned into html for publication—a single set of generated content is all that any client browser ever sees. To complicate the distinction with dynamic sites, there are a variety of caching plugins for Wordpress that try to do the same thing.
This doesn’t mean that a static site can’t be interactive, it just means that any interactivity needs to be handled on the client-side, normally using some flavour of JavaScript. This may actually lead to additional server round-trips as additional data is requested via ajax or similar techniques, based on user interaction. However, since client-side interactivity is a fairly standard approach to creating websites at the moment, you’ll probably find that the same is true for non-statically generated sites too. The ‘static’ part of the name refers purely to the server-side, the generation side, although even there any eventually-static content will be built dynamically from a set of templates and page-specific logic. In other words, the content that is actually served to your browser can still be different from that which I originally write.
What on earth am I talking about? Let’s take an example…
The Experiment
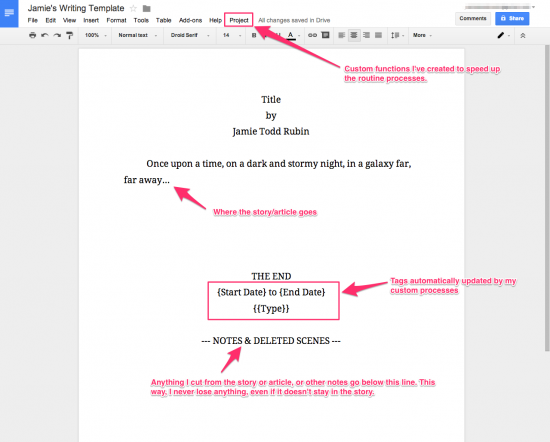
Jamie Rubin is a sci-fi author and programmer who, as part of a more wide-ranging personal project involving self-quantification, has spent some time gathering data about his writing habits and providing visualisations of that data for the benefit of his readers. He uses Google Docs for his writing and has created a set of scripts which will take metadata from those docs and use them as the basis for his visualisations—you can read about that process on his blog.
What would it take to do something similar, making use of only static-website technologies such as Jekyll? There’s no reason you couldn’t plug some offline Google Docs-derived stats into a static website, but we’ll do something different here. Our flow might look something like this:

We could generate some writing statistics offline which we would store and keep updated in a suitable flat data file on the server; use Jekyll templates to interpolate any additional data required; then plug the output into a JavaScript visualisation library so that we can get some pretty and interactive charts.
The data we’ll gather should be as simple as possible, I’ll try to keep it expressible in just a couple of columns in a csv text file. You could use json if you prefer—I’m using a flat csv since it’s trivial to add additional lines to it using a shell script. We should then be able to use Jekyll’s Liquid-derived templating engine to work out any additional calculated data and relationships we need, such as full-period and floating 7-day averages to mimic Jamie’s setup. Google Charts should give us everything required to allow some basic interaction by the end user through JavaScript.
Data Structure
We’ll keep our csv layout as trivial as possible:
date,  fiction,  non-fiction
2015-02-14, 31994,  4438
2015-02-15, 31994,  4463
2015-02-16, 31994,  5156
2015-02-17, 32009,  5283
2015-02-18, 32009,  5413
2015-02-19, 32073,  5552
2015-02-20, 32073,  5700
The fiction and non-fiction columns will be a raw word count and we’ll work out intervals such as daily increase in words written and our averages using tag and filter logic.
So with Jekyll we’ll need to:
- Cycle through each element in the csv
- Turn the raw daily total into a daily increment
- Generate an overall average based on each entry to date
- Generate a floating weekly average to that point
- Work out what period of time we’re going to use for the report
Whereas with JavaScript we’ll only need to:
- Draw the chart
This keeps the division of labour biased pretty heavily toward the one-time generation step.
Collecting Data from Scrivener
Since I use Scrivener for any long-form writing I could just go to it directly for the statistics I’m looking for—it tracks those details in its Project Target metadata, but unlike Google Docs it does not expose that data through an API. That doesn’t stop us extracting it ourselves using a script since the data we care about is held within a readable section of the document package’s interior .scrivx file. It’s held under an element called PreviousSession, which actually refers to the session in progress. A ‘session’ in this context refers to an automatically or manually-reset period of time which we have defined ourselves within the project preferences, so its data will represent any words which have been written between the previous session reset up to the current time.
With a session that we know was last updated yesterday, we could write:
#!/bin/bash

oldIFS=$IFS
IFS='
'

yesterday=`date -v-1d "+%Y-%m-%d"`
totalWordCount=0

for file in `find my_scrivener_folder_location -name "*.scrivx" -type f`; do
  sessionDate=`xmllint --xpath "string(/ScrivenerProject/ProjectTargets/PreviousSession/@Date)" $file`
  if [[ "$sessionDate" == *"$yesterday"* ]]; then
    fileWordCount=`xmllint --xpath "string(/ScrivenerProject/ProjectTargets/PreviousSession/@Words)" $file`
    totalWordCount=$(($totalWordCount + $fileWordCount))
  fi
done

IFS=$oldIFS

echo "$totalWordCount"
For the PreviousSession stats to be useful, any Project Target option to automatically reset the session count must be something sane—exactly what that means for you will depend on how often and how regularly you intend to run your script. If we have a session reset happening at midnight and just target ’today’ at the point that the script is run then we’ll have an incomplete wordcount if any additional writing occurs afterwards.
- Set Scrivener to reset the session target at midnight, or some other time that you know you’ll have stopped writing for the day.
- Or manually reset the target yourself before you start writing on a new day
- Make sure your script runs daily before your current day’s writing begins
The script itself might look something like this:
#!/bin/bash

yesterday=`date -v-1d "+%Y-%m-%d"`
total=`path_to_my/word_counting.script`
printf "$yesterday,$total\n" >> path_to_my.csv
There are a number of ways in which you could automate the running of your script, the simplest probably being an entry in your cron. On os x the standard approach would be to use launchd, however I prefer to use /etc/periodic/daily/, which will still use launchd behind the scenes, in an attempt to guarantee that the script should run once and once only, daily, when my MacBook is awake. There is no real guarantee however…
Collecting Data from Markdown
Going after Scrivener data is one approach, but it’s a little messy and not generally applicable. So let’s talk briefly about my own psychological tics…
Scrivener, like most os x applications, will automatically save any changes made to a project every few seconds—the Snapshots feature even allows you to roll back to earlier auto-saved drafts (even though the app doesn’t support the built-in os x system-level versioning/reverting mechanism for files, since your .scriv document isn’t really a single file at all). This means that my multi-decade muscle memory to spam ⌘-S to save every once in a while to make sure I don’t lose anything is entirely redundant. So let’s repurpose otherwise wasted muscle memory and bind that shortcut to ‘Sync with External Folder Now’ instead:

If you’re not on os x, or just prefer having that keymap unchanged, you can choose a different keybinding of your choice. This is all about reducing friction for me, so I won’t be trying to memorise a new keybinding when an old one is both redundant and semantically correct for this new role.
At this point we can pick up any plain text files stored in the ‘Drafts’ folder(s) in the sync target location and run them through wc. I’m also running them through bc in the below to ensure that we have only numbers in the output:
#!/bin/bash

fiction=`find path_to_my_fiction_folder -type f -path '*/Draft/*.md' -print0 2>/dev/null |
    xargs -0 cat | wc -w | bc`
nonfiction=`find path_to_my_nonfiction_folder -type f -path '*/Draft/*.md' -print0 2>/dev/null |
    xargs -0 cat | wc -w | bc`
echo "$fiction,$nonfiction"
This has the side benefit of also accounting for words added to those files outside of Scrivener itself, since the reason I sync to an external folder in the first place is to make use of cloud storage and have those files available on any of my devices.
Making use of the Data
You can read more detail about the setup process for data files on the main Jekyll documentation site, but now that we have our source statistics we need to set up the Jekyll-side to make use of them. Liquid markup isn’t always the cleanest in the world, although the lack of any particularly complex syntax does mean that any logic you write is normally fairly parseable and reads much like pseudocode. It does end up looking fairly convoluted when we’re working with specific reporting periods, loop offsets, and integer-to-float hackery though:
{% raw %}
data.addRows([
    {% for entry in site.data.progress offset:period %}
        {% assign total = total | plus:entry.fiction | plus:entry.non-fiction | minus:priorTotal %}
        {% if counter > 7 %}
            {% assign 7dayMarker = forloop.index0 | plus:period | minus:7 %}
            {% assign 7dayTotal = 7dayTotal | plus:entry.fiction | plus:entry.non-fiction |
                minus:site.data.progress[7dayMarker].fiction |
                minus:site.data.progress[7dayMarker].non-fiction | minus:prior7dayTotal %}
        {% endif %}
        [
            new Date({{ entry.date | date: "%Y" }},
                {{ entry.date | date: "%m" | minus:1 }},
                {{ entry.date | date: "%d" }}),
            {% assign priorEntry = forloop.index0 | plus:period | minus:1 %}
            {% if counter > 1 %}
                {{ entry.fiction | minus: site.data.progress[priorEntry].fiction }}
            {% else %}
                {{ entry.fiction }}
            {% endif %},
            {% if counter > 1 %}
                {{ entry.non-fiction | minus: site.data.progress[priorEntry].non-fiction }}
            {% else %}
                {{ entry.non-fiction }}
            {% endif %},
                {{ total | append: '.0' | divided_by:forloop.index }},
            {% if counter > 7 %}
                {{ 7dayTotal | append: '.0' | divided_by:7 }}
                {% assign prior7dayTotal = 7dayTotal %}
            {% else %}
                0
            {% endif %}
        ],
        {% assign counter = counter | plus:1 %}
        {% assign priorTotal = total %}
    {% endfor %}
]);
{% endraw %}
You can read more about the Google Visualisation API on Google’s Developer pages, but we’ll really just need to set up some chart options and make sure the drawing function is called—I’ve put a full example of what the code for a complete transformation from simple date/count pairing into a more featureful graph with a calculated period average and floating 7 day average could look like into a gist for reference.
Putting it all together
It’s a fairly limited example, but hopefully it illustrates the main points:
- Any visitors coming to this page will get exactly the same data presented in exactly the same way.
- No new data is being retrieved by the site on each of those visits or when any of the period buttons are clicked.
- I don’t need to manually update the page content to reflect any new data which is added over time.
- The graph and its buttons will behave as though they’re being updated in a more traditional fashion from a database.
The only real limitation to this approach—Leaving aside your thoughts on how robust all that Jekyll tags logic and shell scripting might be—is that it relies on data captured locally being pushed to GitHub so that Jekyll can update the html which forms the data-set. This isn’t really a limitation of static websites in this case though, since even a dynamic site would need its back-end database updated, possibly via similar means, and for the same reason.
Feel free to browse/borrow/tweak the finished source code for your own purposes.
Static generation dynamic content ·
references
http://en.wikipedia.org/wiki/Static_web_page
http://blog.getpelican.com

Transform your plain text into static websites and blogs
http://octopress.org

http://en.wikipedia.org/wiki/Content_delivery_network
http://en.wikipedia.org/wiki/Content_management_system

A very fast caching engine for WordPress that produces static html files.
http://en.wikipedia.org/wiki/Ajax_(programming

Writer, Coder, Avid Reader
ince February 2013, I’ve used Google Docs for my writing. I’ve always been a fan of Scrivener, and I still use Scrivener to prepare submission drafts. But for a year and a half now, I u…
http://jekyllrb.com/docs/templates/

Discover the resources for adding interactive charts for browsers and mobile devices.
Discover the #1 novel & book writing software for writers! Streamline your writing process with powerful tools designed to help organize, edit, & bring your story to life.
http://www.thexlab.com/faqs/maintscripts.html#Anchor-How-35882
http://www.literatureandlatte.com/forum/viewtopic.php?f=4&t=78&p=123475&hilit=lion+autosave#p123475
http://support.apple.com/kb/PH14378
In addition to the built-in variables available from Jekyll, you can specify your own custom data that can be accessed via the Liquid templating system.
https://developers.google.com/chart/interactive/docs/reference

Combining the Google Visualisation API with Jekyll. See: http://fernseed.org/technology/static-generation/ - add-data-to-csv.sh